
No significant stock price reaction following a net-zero commitment announcement, among other key findings
No significant stock price reaction following a net-zero commitment announcement, among other key findings
By Allen He
On 28 April 2021, FCLTGlobal hosted an info session on the topic of quantifying the market value of corporate net-zero commitments. This conversation served as an opportunity to share our preliminary research with a diverse group of attendees from global corporate and investment communities. In turn, we were able to benefit from their unique perspectives and insights on how net-zero commitments factor into decision-making. Below are key findings and takeaways from the discussion.
Overall, our research found no abnormal price reaction (positive or negative) in the days following a net-zero announcement. Of the subsamples we looked at:
While stock price reaction was minimal, we did find a significant increase in volume traded both on the day of (+8%) and the day after (+10%) a net-zero announcement. Volume traded during these two days was significantly higher compared to both prior 15-day and post 15-day averages, which might be due to the presence of short-term, high-frequency traders using this information as a signal to buy or sell.
Curiously, while there was a significant increase in volume, there was no significant increase or decrease in stock price. It remains unclear whether this is a result of an underlying shift in shareholder base (such that as short-term investors exit, longer-term investors enter) or whether different high-frequency traders interpret net-zero news differently. Of the several subsamples we looked at:
Whatever the case, it seems that markets are indifferent to corporate net-zero announcements in the short term; there is no immediate material impact on companies’ stock prices. There could be a shift in shareholder base post-announcement, but further in-depth testing of this hypothesis would likely require detailed historical data from corporate shareholder registers.
Contrary to the relative short-term indifference in the markets, in the medium-to-longer term, there is indeed value in a net-zero commitment. Our research found that a portfolio of net-zero companies outperformed a broad MSCI ACWI benchmark by an average of 3% annually. Figure 1 shows that, all else equal, the value of $1,000 invested in net-zero committed companies at the beginning of 2018 would have grown to $1,400 in 2021, compared to $1,300 if invested in the MSCI ACWI.3
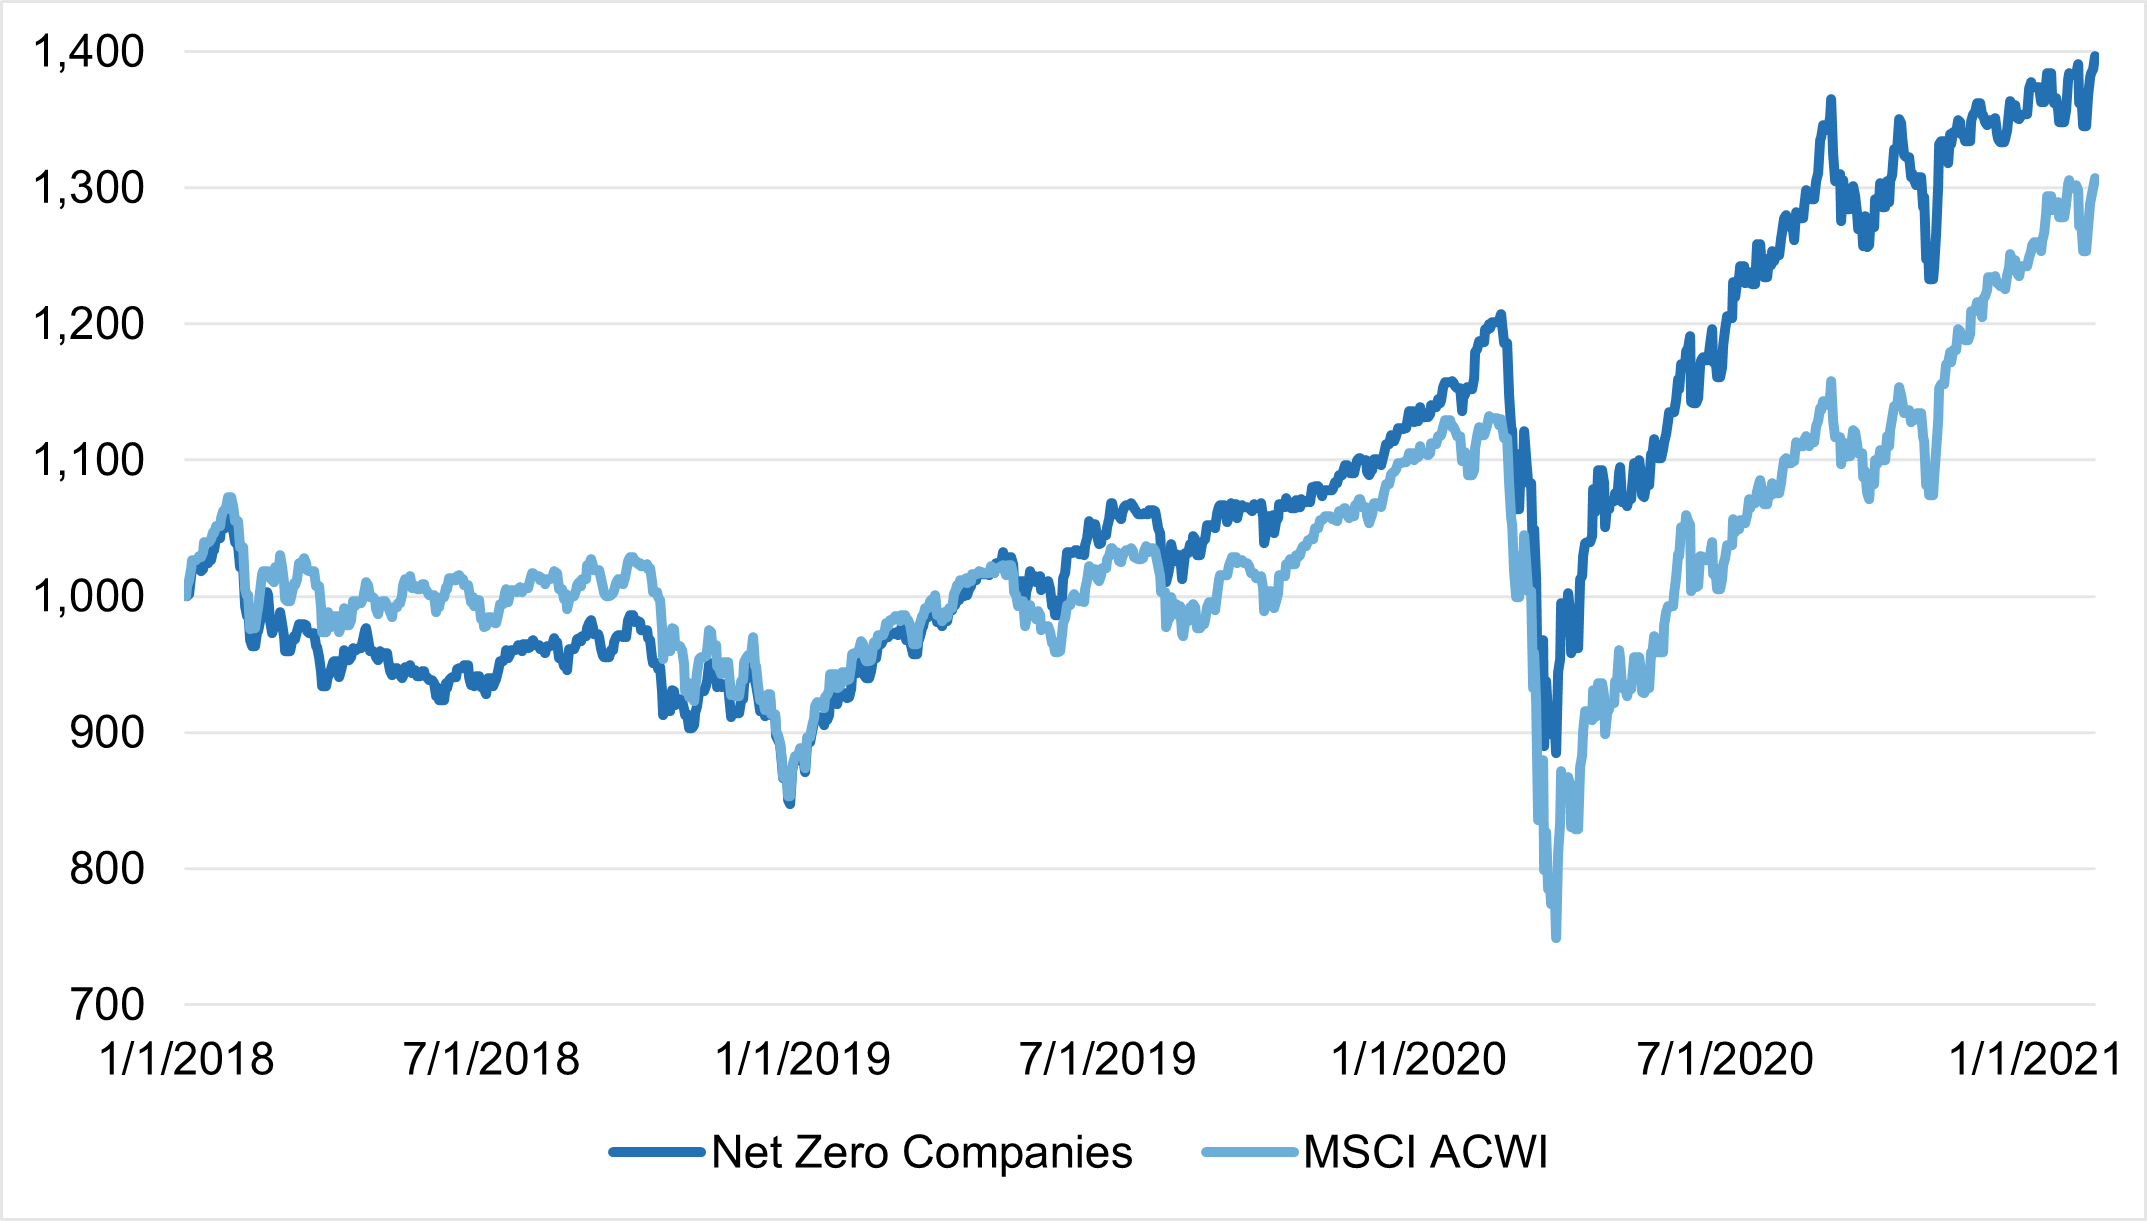
We acknowledge that sector and geography biases may play a role in this result, but while a portfolio of net-zero companies overweights the consumer staples and utilities sectors (which have generally done well over the past 3 years), it also underweights the finance and IT industries (which have also outperformed other sectors during this time). Overall, these biases may explain in part the differences between the two portfolios.
As of early 2021, green bonds trade at a 3bp premium over traditional bonds, but this hasn’t always been the case. Figure 2 below shows that from 2018 to mid-2020, green bonds actually traded at a 3-7bp discount compared to traditional bonds. And while this relationship has slowly crept towards parity over the years, it was not until late 2020 that green bonds began trading at a premium compared to traditional bonds.
Figure 2: Green Bond Premium vs. Traditional Bonds (in bp)
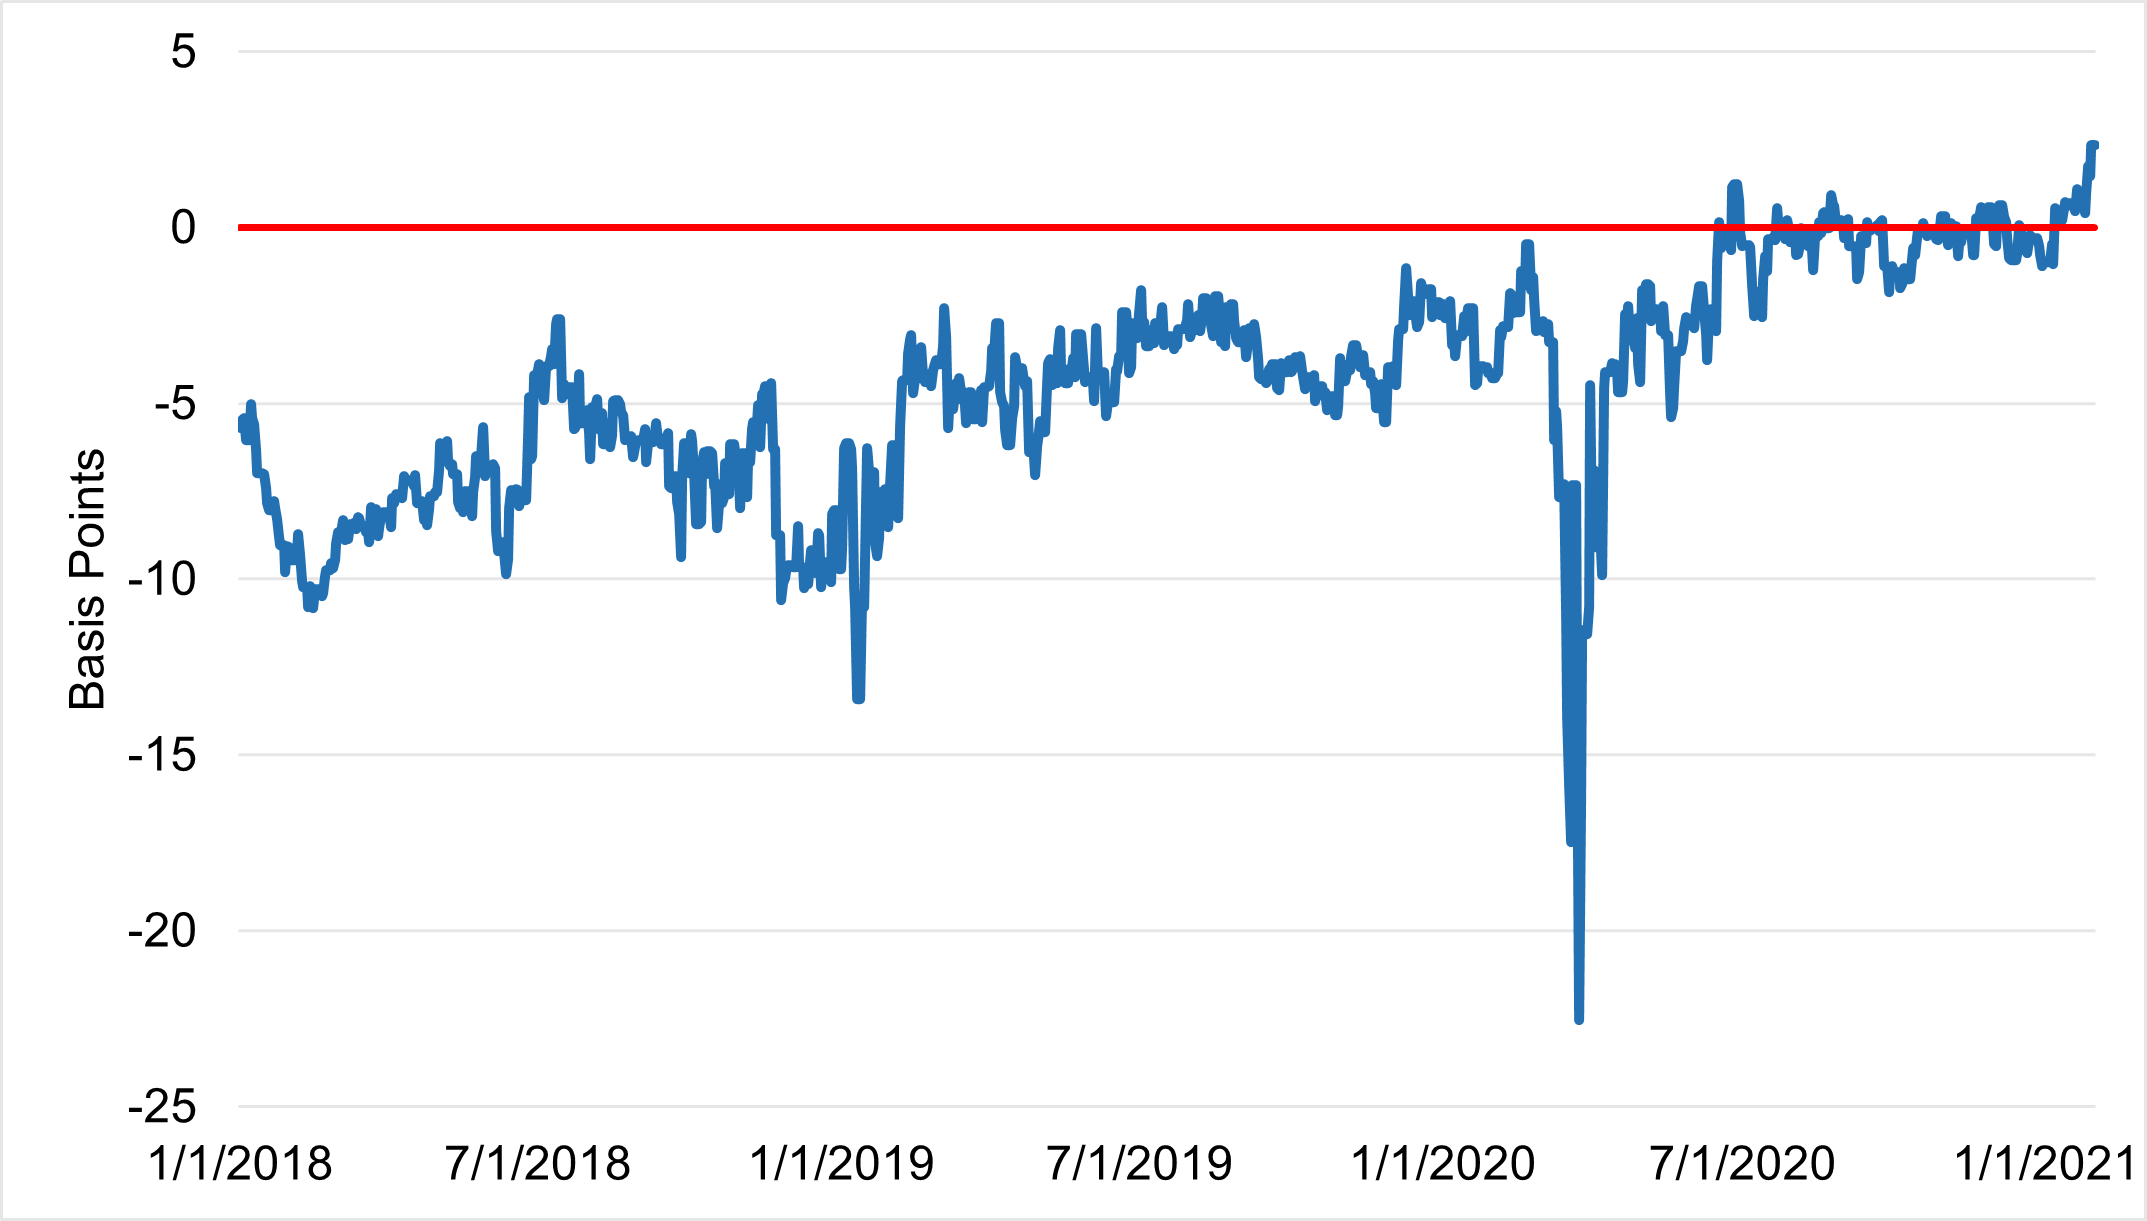
As a participant noted during the info session, it could be that markets are just now beginning to recognize the value, risks, and opportunities that climate change brings to a portfolio, both in the equity and fixed-income space.
Our research shows that as of early 2021, green bonds issued by net-zero committed companies trade at a 6bp premium versus traditional bonds from the same issuer. However, once we look at non-net-zero committed companies, this premium disappears entirely (the difference between green and traditional bonds at these companies is exactly 0 basis points).4
Furthermore, geographic and sectoral breakdowns show that this premium is more pronounced for Europe and North America (3bp and 6bp respectively, compared to 0 for APAC), and for SASB greenhouse gas material sectors (i.e. agriculture, chemicals, oil & gas). Although academic evidence is mixed on whether or not a green bond premium exists at issuance, we find that a “greenium” does exist on the secondary market.5
While markets may not reflect the value of a net-zero commitment in the immediate days following the announcement, we are beginning to see a material difference in the medium to longer term. As investors become more aware of the materiality of such pledges and climate risk in general, there may be a re-pricing of assets – a trend that first started in Europe but has now begun to emerge in other markets, namely North America and Asia-Pacific.
Several participants noted that while some companies are much further along in hitting their targets, others have only just begun their journey. To help categorize where a given company may fall on the spectrum, the Science Based Targets initiative (SBTi) has identified several different levels of commitment – from the standard 2-degree to 1.5 degrees, to even a preliminary announcement (with detailed corporate plan up to two years later).6 From an investor’s perspective, it may be one thing for a financial bank with a small carbon footprint to make a net-zero commitment, but quite another for an oil and gas giant to transition towards carbon neutrality. It can take as much effort as ten net-zero commitments from consumer staples firms to offset the carbon emissions of a single energy giant – and the market may be taking this into account in evaluating those announcements.
In addition to knowing how and by when companies are hoping to reduce their carbon emissions, knowing why companies make such commitments (e.g. signaling to investors, greenwashing, short- and long-term cost savings) and where such a plan fits into a company’s long-term climate roadmap can be helpful. To date, our research on quantifying the value of a net-zero commitment focuses on making the case for medium-to-longer-term materiality in corporate climate commitments. In the coming months, we plan to evaluate how to better incorporate climate-related information into discussions about long-term strategy.
We thank all those who joined us for this important discussion and welcome further suggestions and collaboration opportunities on this topic. If you have any further insights relevant to the issue, or specific questions regarding the datasets and methodology, please contact [email protected]
1 Event study methodology similar to that of Seraphim and Yoon (2021) was used: 60-day estimation window, 15-day observation period. Underlying dataset combined a list of net-zero committed companies from the Science Based Targets Initiative (SBTi) and their commitment dates.
2 Note that this result could be driven by a small sample size: far less energy firms have committed to going net-zero than, say, consumer goods companies.
3 Similar to the MSCI ACWI, the portfolio of net-zero companies was market-cap weighted and rebalanced twice a year at the end of May and November.
4 We used a matched-pairs methodology similar to that of Flammer (2021). Bonds were matched based on maturity date, tranche, coupon type, rating, and currency denomination.
5 See, e.g. Larcker and Watts (2020) and Baker (2018).
6 For more on the different levels of commitment, see https://sciencebasedtargets.org/resources/files/SBTi-criteria.pdf (p. 16).